
Bring information together, improve reporting, and turn enterprise data into insights that support day-to-day operations and management decisions.
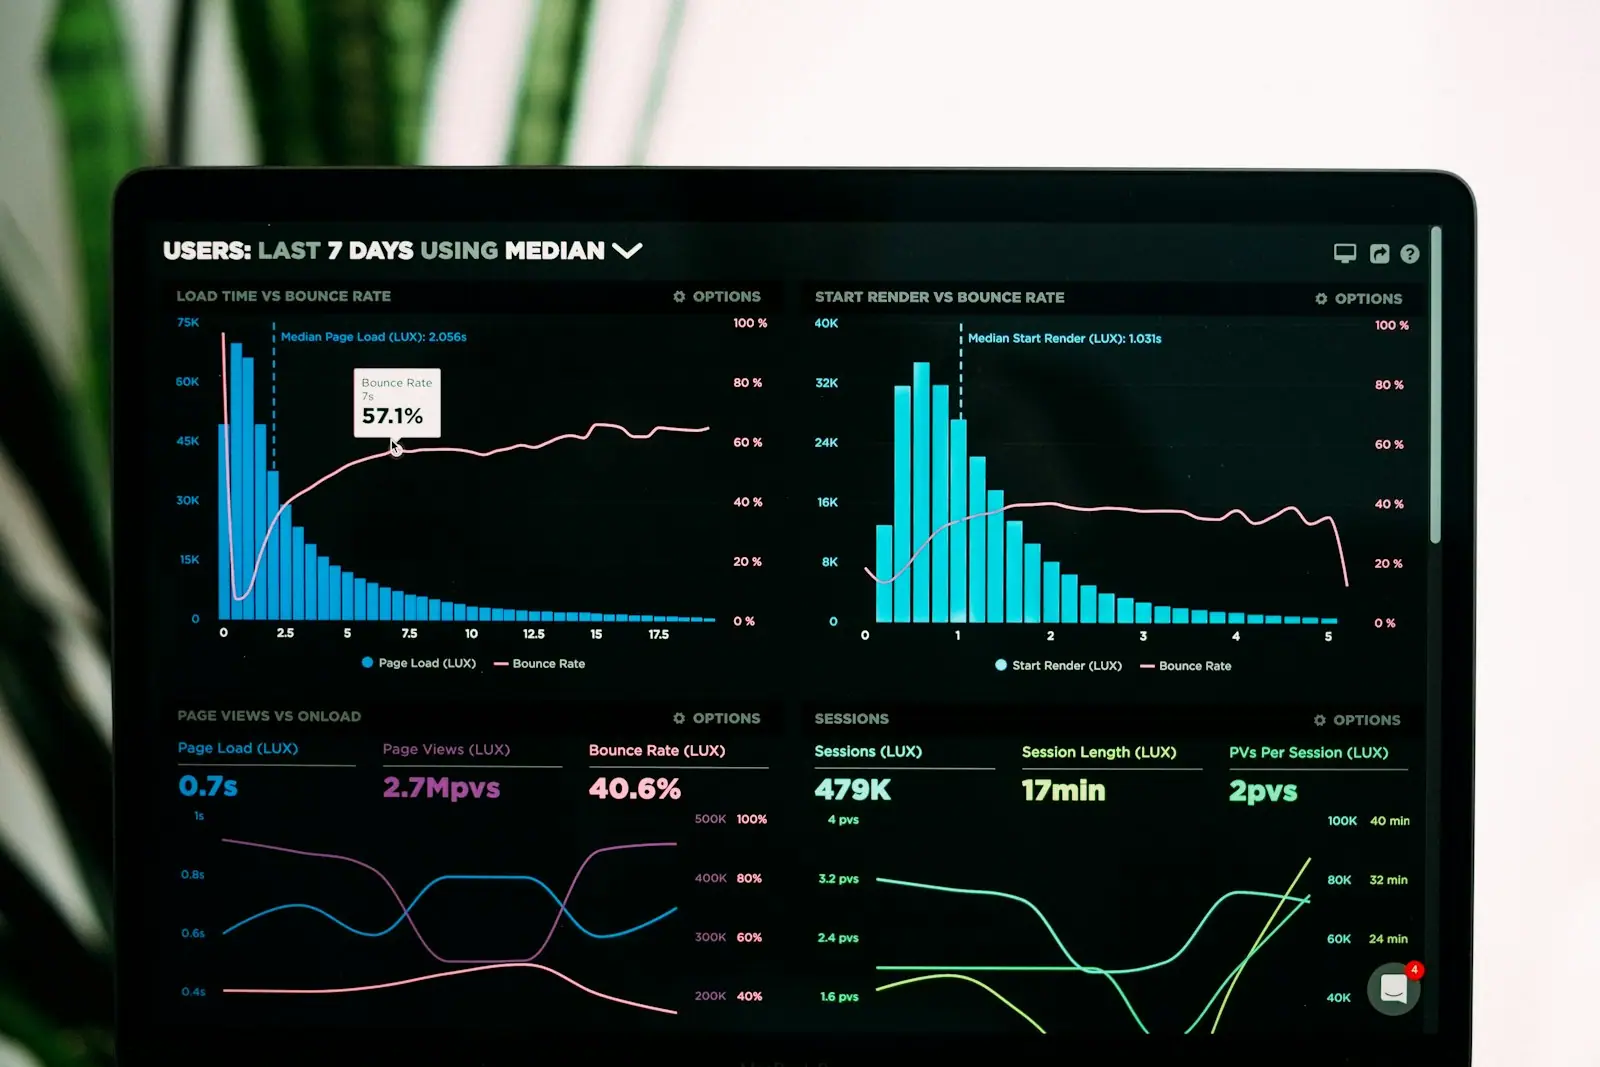 Data Warehousing
 01
Data Warehousing
Consolidate and organize enterprise data from multiple sources within secure, cloud-based environments designed for reporting, analysis, and data management.
 02
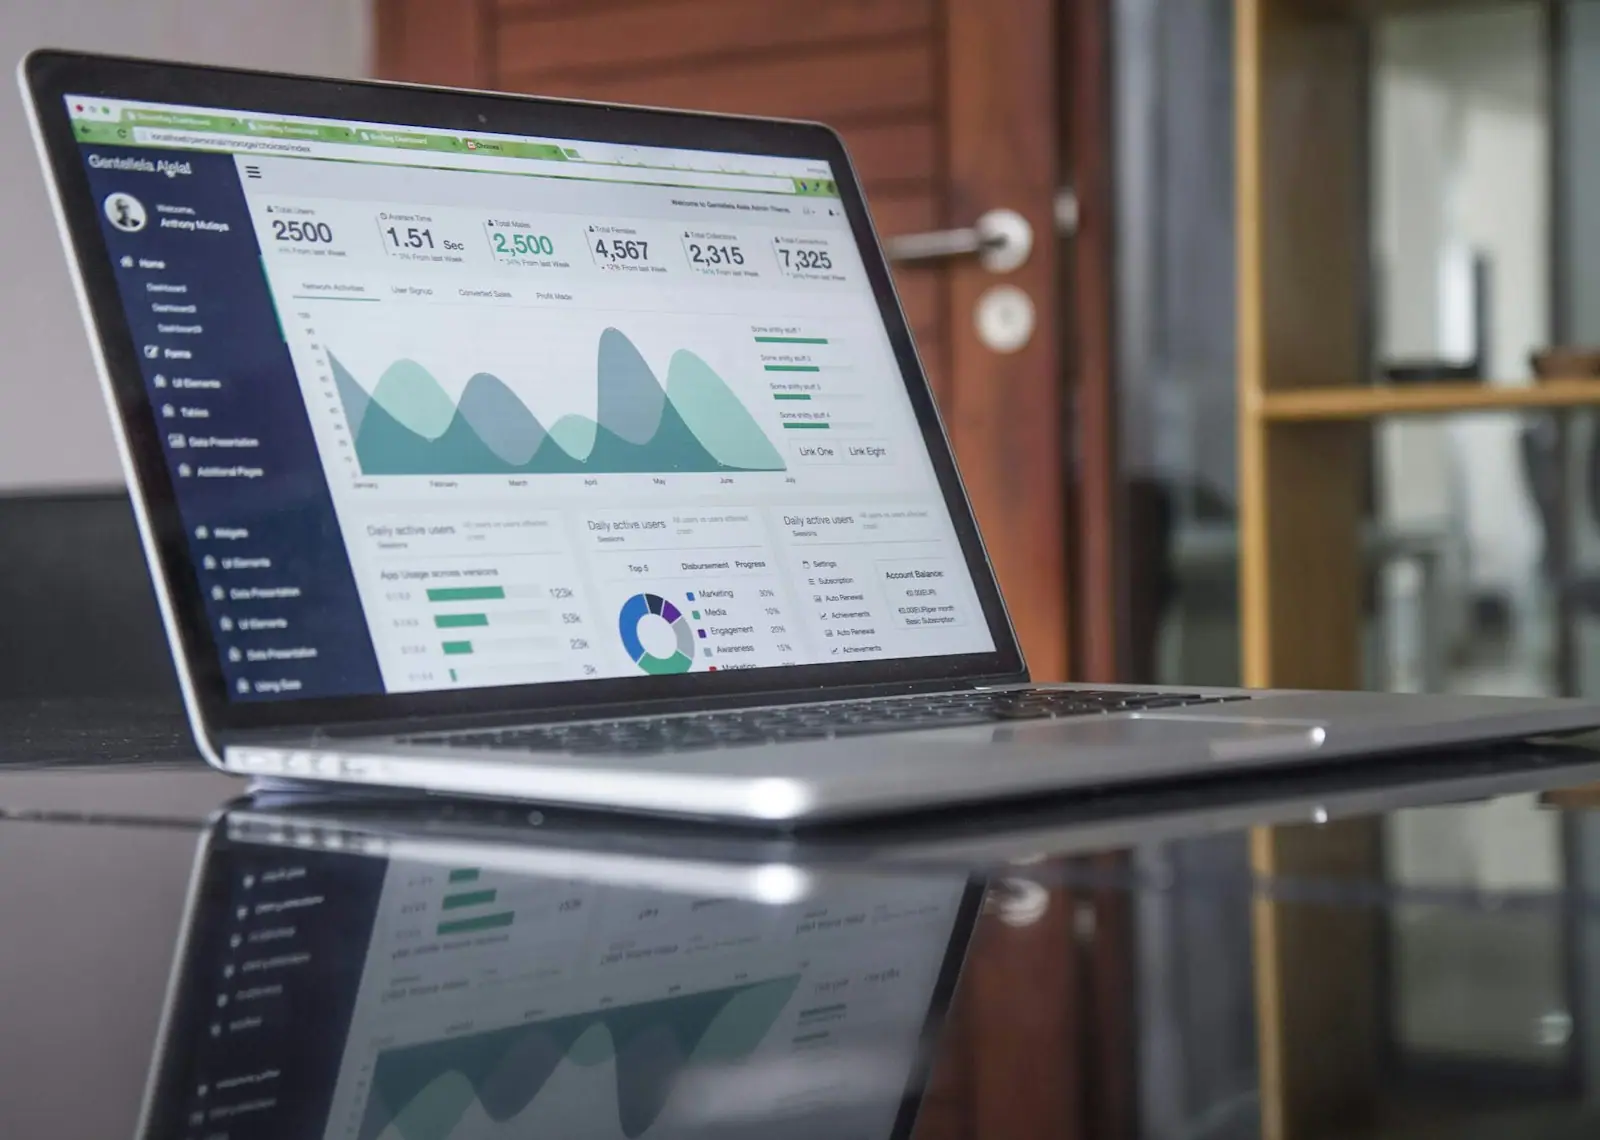
Power BI Dashboards
Develop interactive Power BI dashboards that present operational and financial performance clearly, including real-time views, helping businesses monitor key metrics, identify trends, and make informed decisions
 03
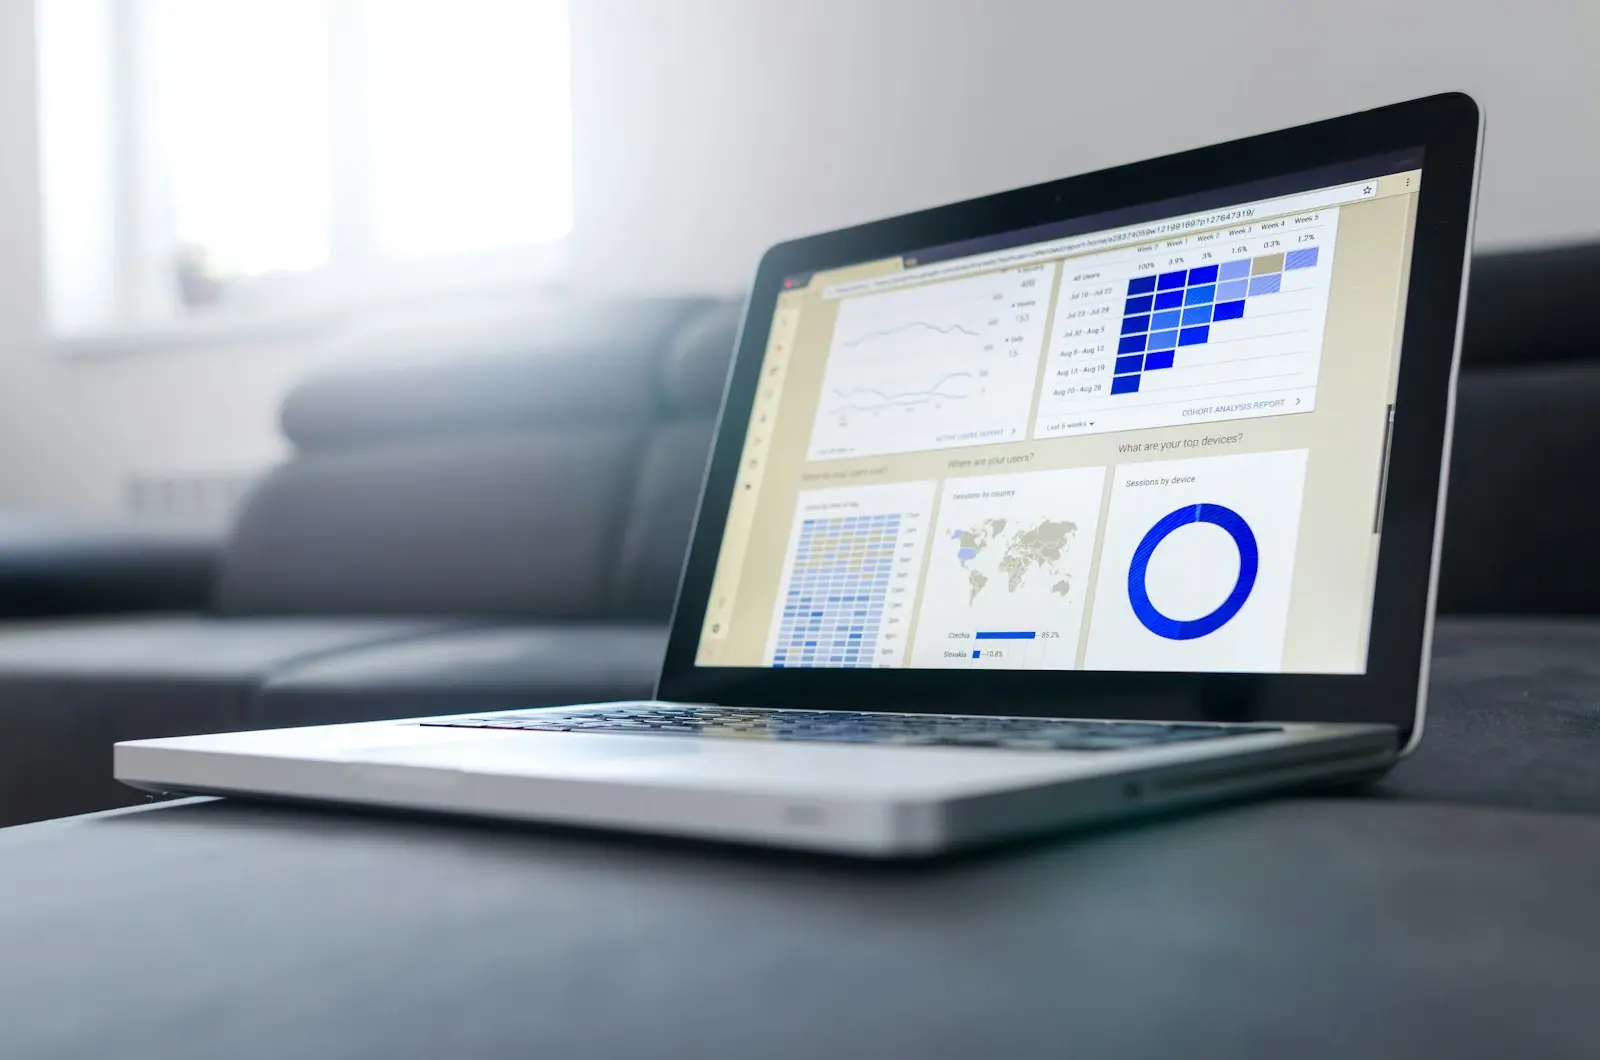
Business Reporting
Automate recurring daily, monthly, and financial reports, reducing manual preparation and making information more consistent across departments.
 04
Predictive Analytics
Use historical and operational data to forecast inventory demand, identify emerging patterns, and detect early indicators of potential equipment failures.
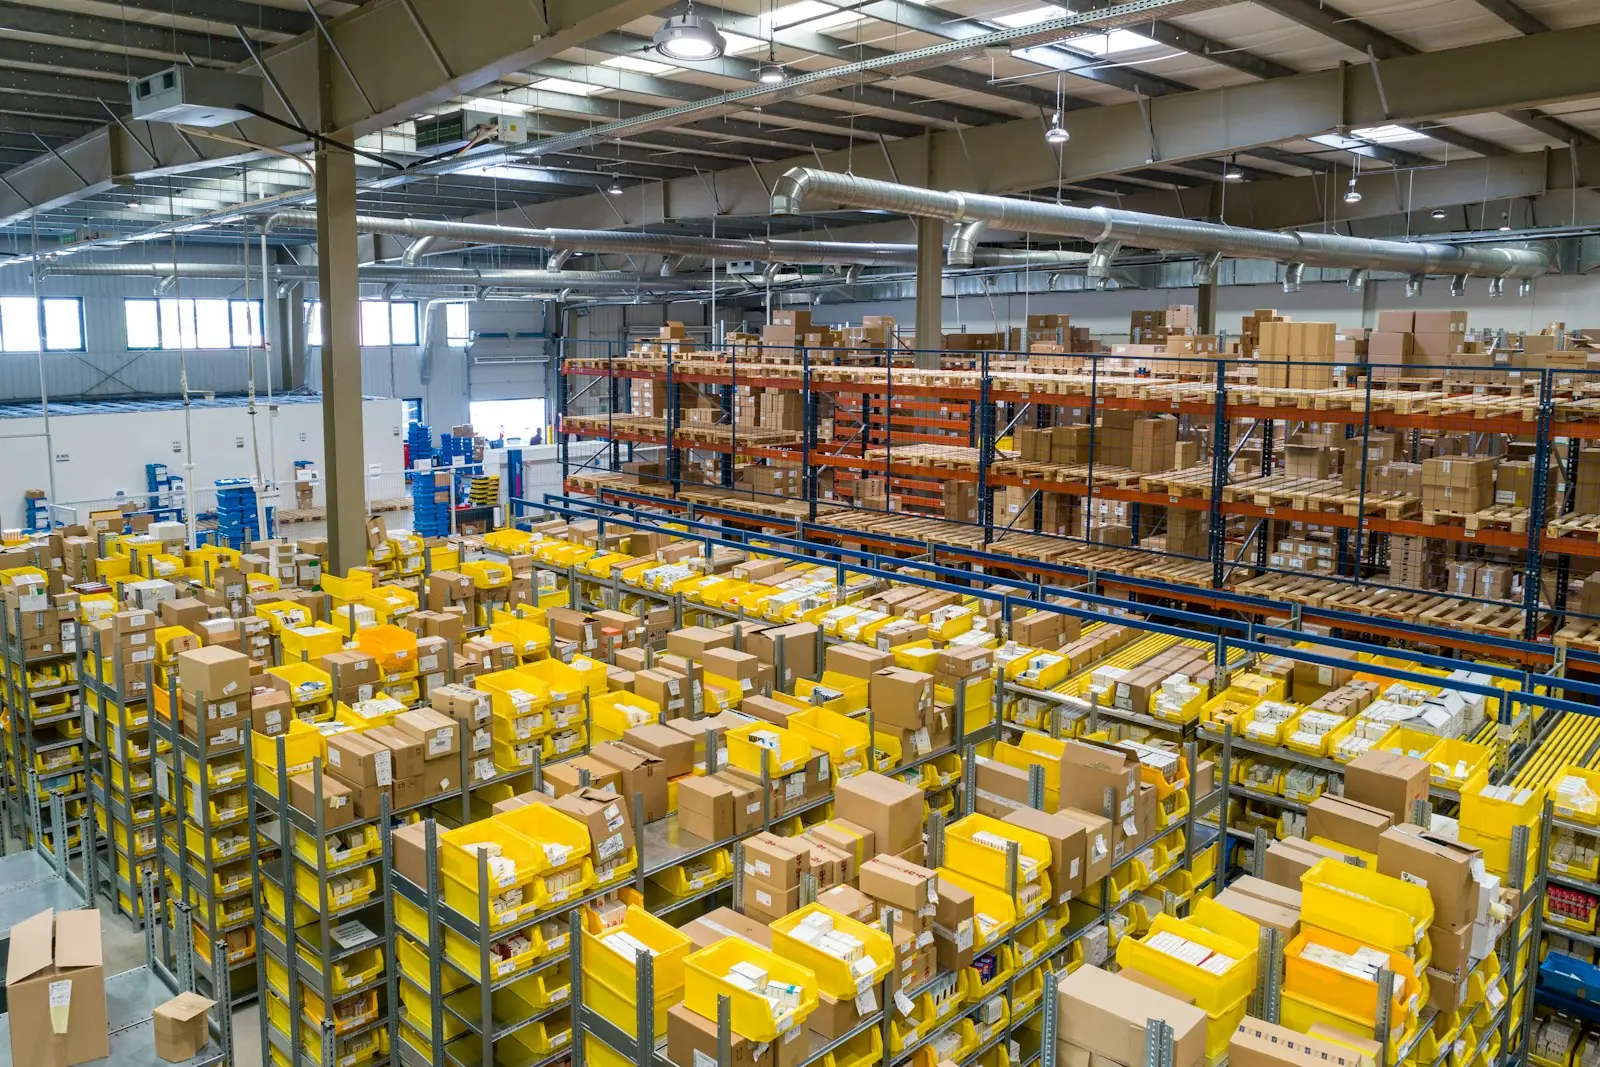
As businesses grow, information becomes spread across multiple systems and departments. Inconsistent data, manual reporting, and limited visibility can make it difficult to assess performance, identify trends, and make timely decisions.
- 01
Fragmented Enterprise Data
Information scattered across different applications and departments makes it difficult to maintain a consistent view of business performance.
- 02
Limited Business Visibility
Lack of clear, accessible dashboards can prevent teams from monitoring key metrics and identifying operational issues on time.
- 03
Time-Consuming Reporting
Manual data collection, spreadsheet preparation, and repetitive reporting tasks consume valuable time and increase the risk of errors.
- 04
Difficulty Anticipating Business Needs
Limited use of historical and operational data makes it harder to forecast demand, recognize emerging trends, and identify potential operational risks.
We help organizations improve information accessibility, streamline reporting, and make more informed decisions across business functions.

- 01
Improved Data Accessibility
Bring information from multiple sources into organized data environments, making it easier for teams to access and analyze business information.
- 02
Greater Operational Visibility
Provide clear dashboards and performance indicators that help teams monitor operations, track progress, and identify areas requiring attention.
- 03
More Efficient Reporting
Reduce manual reporting effort through automated data preparation and recurring reports, improving consistency across departments.
- 04
Better Planning and Forecasting
Use historical patterns and operational data to support demand forecasting, resource planning, and earlier identification of potential risks.
Evaluate the impact of data and analytics initiatives through improvements in reporting efficiency, information quality, forecasting, and operational performance.

- 01
Data Quality & Accessibility
Measure data completeness, accuracy, consistency, and the time required to access business information.
- 02
Reporting Efficiency
Track report preparation time, manual effort, and recurring reporting costs.
- 03
Decision-Making Efficiency
Evaluate the time required to identify performance issues, analyze information, and prepare management reports.
- 04
Forecast Accuracy
Compare predicted demand with actual results and monitor improvements in inventory and resource planning.
- 05
Operational Cost Efficiency
Assess reductions in reporting-related rework, manual data handling, and avoidable operational costs.
Let's Build What's Next for Your Business.
Whether you're modernizing existing systems, improving operations, or planning a new technology initiative, Digital Futurus brings the expertise to help you move forward with confidence.